Part one of a three part whitepaper series about the future of energy and the role of Oil and Natural Gas in that future.
Executive Summary
I’m increasingly convinced the ESG movement (Environmental, Social, Governance), which is trying to restrict investments in oil and gas ventures, will have the perverse effect of reducing energy supply even as global demand increases, thus making energy prices rise. It is simply not rational for the developed world to expect developing countries to ignore their citizens’ need for power and clean water. These require energy, and specifically oil and gas (and to some extent coal).
History clearly shows that increased energy use (of all types) drives humanity’s health and prosperity. This year will again bring an all-time high in demand for oil and gas, a trend that has only been temporarily broken during recessions quickly recovering. I am bullish over the medium and long-term on the prospects for oil and gas prices.
This is the first of a series of research papers on energy. This paper will cover the basics of supply and demand, briefly look at some of the geopolitics of energy and oil in particular and then end with a quick summary of how a properly designed oil and gas fund can create value in this economic climate. Note that I am a general partner in King Operating Partners II LP (the “Fund”) and serve as the Chief Economist for the company behind the Fund, King Operating Corporation.
(Please read the risk disclosures at the end of this paper. This paper is not an offering for an investment in the Fund, but rather for you to decide if you are interested in learning more. You must have the offering documents and talk with one of our senior team members before you can actually invest.)
And now, let’s turn to the report.
Energy is the True Driver of Global Growth
In 1651, English philosopher Thomas Hobbes in his magnum opus Leviathan described life conditions for most of humanity as “solitary, poor, nasty, brutish, and short.” He said that despite amazing progress in immediate prior centuries: the printing press, sailing into the wind, the Magna Carta, and many other civilization-altering inventions and discoveries. This progress continued with the development of the rule of law, property rights and competition, and then historic breakthroughs in science and medicine.
While that productivity and economic growth, were astounding when looking backwards from 1500 to1651, from a 2023 perspective global growth really didn’t begin to take off until the 1800s.
Global GDP (in 2011 dollars) was roughly $430 billion in 1500 and had only tripled by 1820. Still, that was far better than the roughly flat GDP growth of the Christian era’s first 1,000 years. It took another 500 years to double. The next two centuries saw a total of 50% growth. Then something happened in the late 1700s: the steam engine and the fossil fuel era. You can see it in the chart below.
Energy literally transformed the world. By 1900, global GDP had grown to $3.4 trillion. But not every problem got solved. Abundant food and trade created a growing middle class in the developed world. There were 50,000 horses in London and 100,000 in New York. New York was literally swamped with two and a half million pounds of horse manure a day. The London Times predicted that unless something was done, “In 50 years, every street in London will be buried under nine feet of manure.” An 1898 urban planning conference broke up with no conclusions, not realizing the solution would appear on the streets of New York in a few years: automobiles.
And that has been the story of the last 200 years of the human experiment: the increasing use of energy. If you want to see a real hockey stick on energy, here it is in GDP terms.
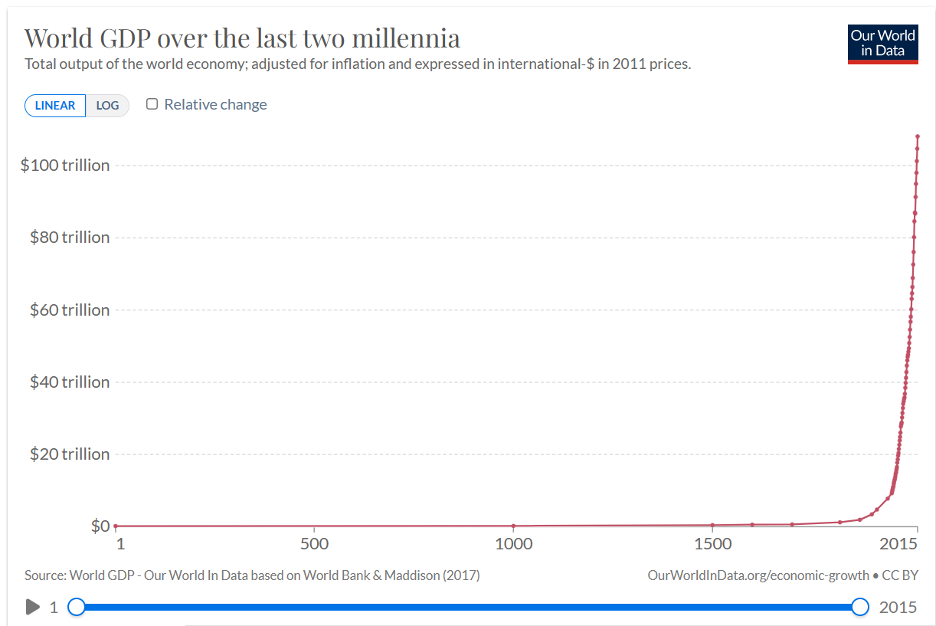
Source: Our World in Data
Global GDP has risen over 60 times since 1960 and per capita GDP is up almost 30 times, even as global population rose only 2.5 times.
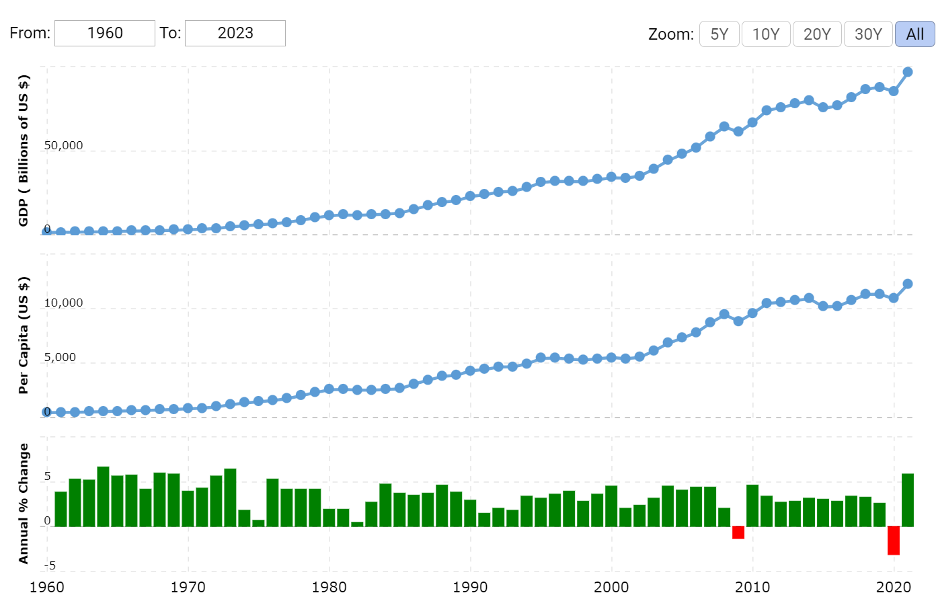
Source: MacroTrends
The only other chart showing such hyperbolic growth is global energy consumption. Take a short minute and let the impact of the chart from Our World in Data register. Most of us take for granted the rise in GDP, the massive increase in general human prosperity and lifespans, medicines, and all the other conveniences due to fossil fuels oil, natural gas and coal).
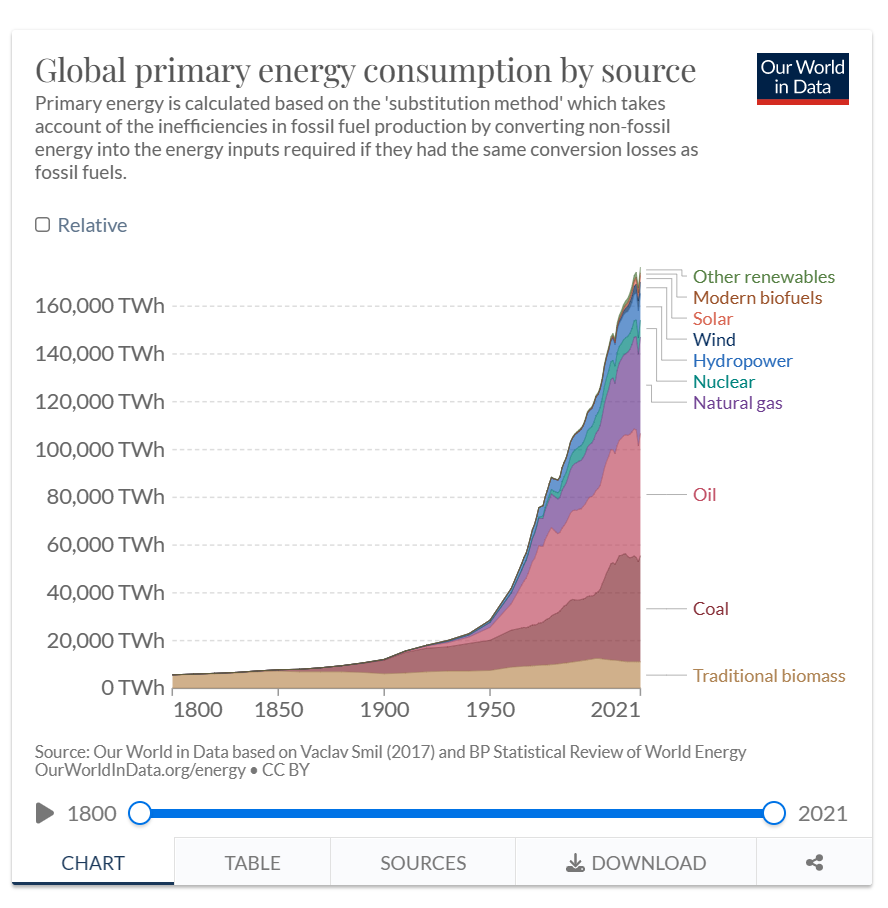
Fossil fuels account for more than 80% of our total global energy consumption. Solar and wind and other renewables are less than 10%, especially if you take out burning wood as a renewable source of energy. Literally, countries can burn wood in Europe for electricity and it doesn’t count towards their carbon footprint. In the category of you can’t make this up, “green” Denmark imports 3 million tons of wood pellets to produce electricity, much of it from US forests.
When the Danes learned that Denmark counts imported and burned Amazon wood as “green,” the scandal created an uproar when it was learned that they are even importing Amazon wood to burn. In theory, as one official said, Denmark could burn the entire Amazon forests for energy and call it green. I find it curious that we are burning more wood today than we did in 1800, although the major world forests, except some tropical forests are in fact growing from where they were 100 years ago.
Here’s another way to look at that same data by percentages:

Source: Our World in Data
The Demand for Energy
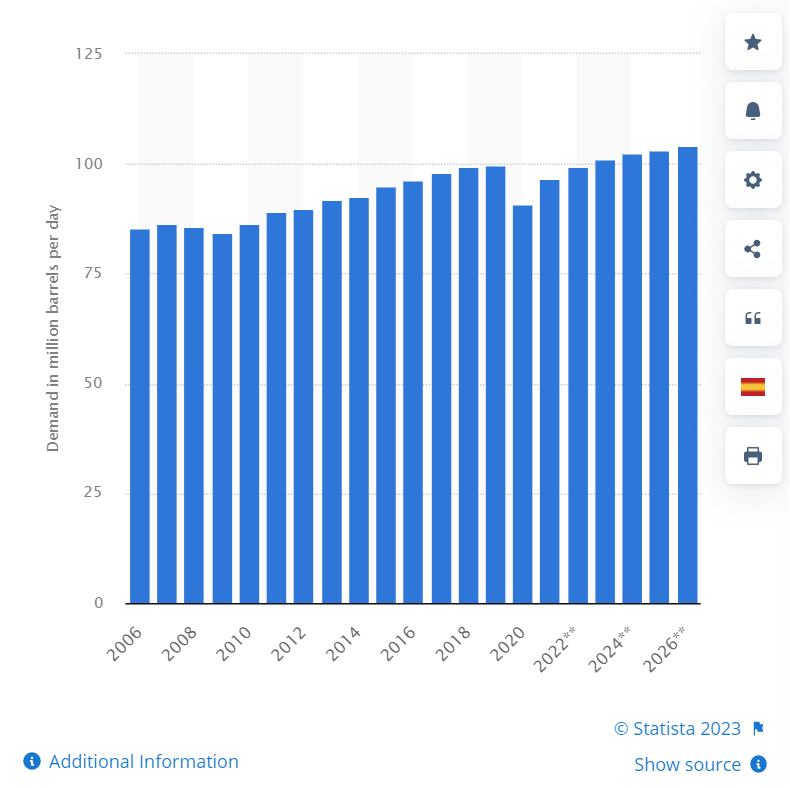
Global energy demand is clearly increasing, but there are nuances. First, let’s look at general global demand for just oil, as that is our main topic today.
Daily demand for crude oil worldwide from 2006 to 2020, with a forecast until 2026*(in million barrels per day)
Source: Statista
From Washington Examiner :
“Worldwide oil demand is predicted to rise by 2 million barrels per day in 2023, the International Energy Agency said Wednesday, reaching an all-time high due largely to higher demand from China as it lifts its harsh zero-COVID policies.
“Global oil demand is anticipated to reach a record high of 101.9 million bpd in 2023, the Paris-based agency said Wednesday in its closely watched Oil Market Report, up from a slowdown toward the end of 2022 and a 1.4 million-bpd rise from the previous record seen in 2019.”
With China re-opening faster than expected after COVID, the EIA seems to revise their energy demand forecasts upward every quarter. In January 2023 Statista projected 101.2 million bpd based in IEA data. Less than a month later this was revised to 101.9.
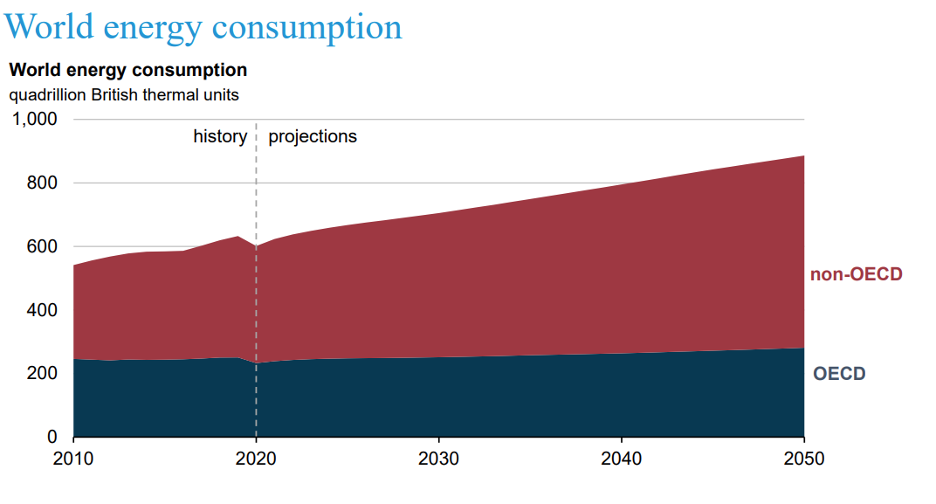
This brings us to EIA’s projections regarding differences between the developed (OECD countries) and the developing world. Notice how developed world oil demand has been and is projected to remain basically flat. Not surprisingly, oil and gas demand growth is almost entirely in the developing world as they seek improved living standards just as we have in the West.
Note also that demand increases whether oil and gas prices are high or low. You must add OECD and non-OECD together to get total consumption. This chart is two years old and is already out of date as demand is higher today than was forecasted a few years ago.

Source: EIA
It’s not just oil and gas. Here are the same projections for total global energy. Again, almost all the forecasted growth comes from the developing world.
Source: ResearchGate
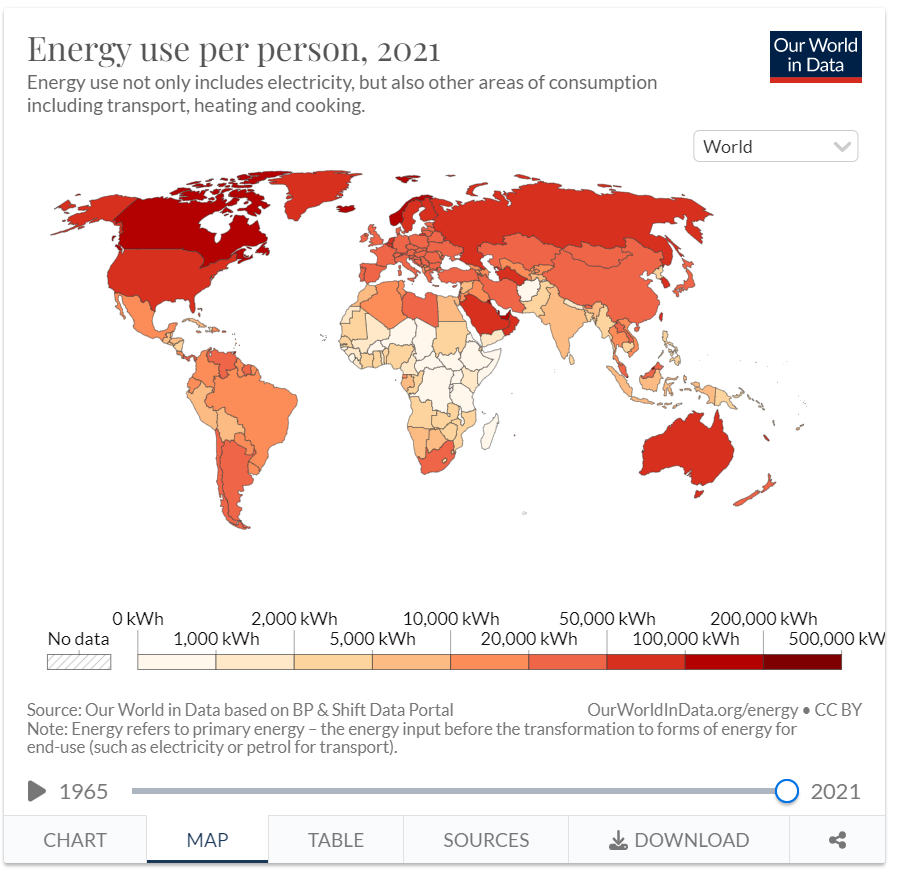
The map below shows energy use per capita. The darker countries are nearly all developed but, as we see above, the less developed countries are trying to catch up. Think about how much energy demand will grow if India simply rises to China’s rate? Or if the rest of the world catches up to the West?
Source: Our World in Data
“Globally, energy demand is growing dramatically (+30% for 2040 according to the Global Energy Institute) and is driven above all by the growth and modernization of developing countries. In fact, energy needs move in parallel with development, the degree of industrialization and population growth. The most advanced economies will not be able to reverse this process. It is difficult to think that emerging countries can be expected to pay particular attention to ‘sustainable’ – and therefore more expensive and limited – growth, and it is even more paradoxical to expect such a commitment in the face of the inability of developed countries to do the same” (Source: Nuclear Power Can Save the Planet – Political Horizons (orizzontipolitici.it).
Seriously, what developing country politician is going to say we must be happy with using half (or less!) the energy the developed countries use, simply because that is somehow better for everyone else?
Energy use will increase so where will that oil come from? Most world (non-US) production has been essentially flat for the last 6-8 years. The US has led net new production and is now the largest producing country.
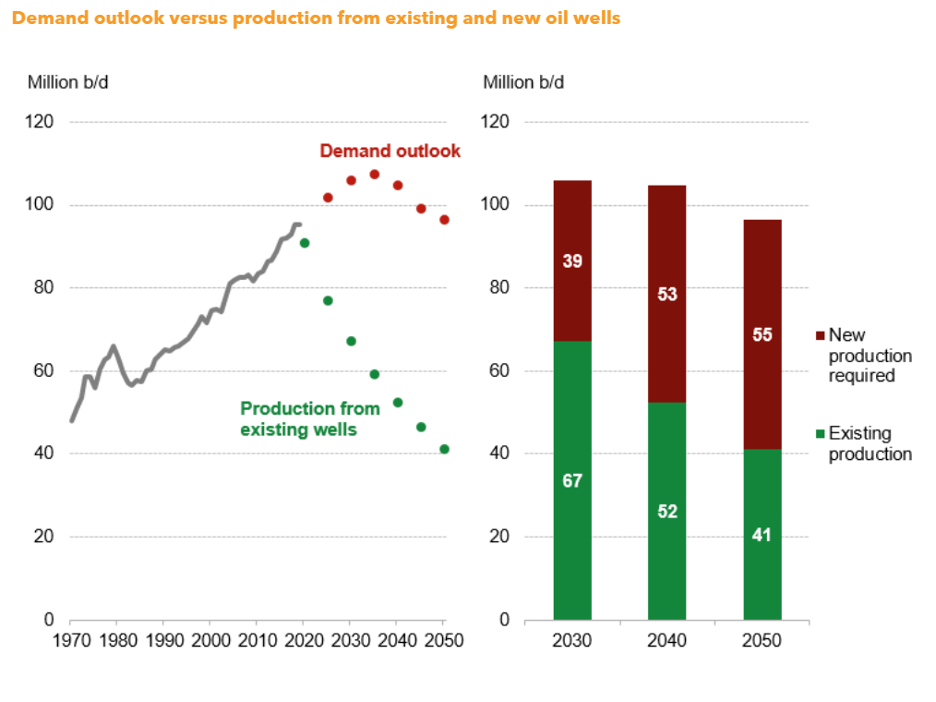
Where do we get that energy, and specifically oil and gas? First, let’s look at current productions and what the same wells would produce in a future with no new wells.
All oil and gas wells are subject to depletion. Over time, even an initial 10,000 bpd well will fall to single digits. Production from existing wells over the next 27 years will drop to much less than half. We need new wells just to stay even, let alone meet, rising demand.
Source: Bloomberg
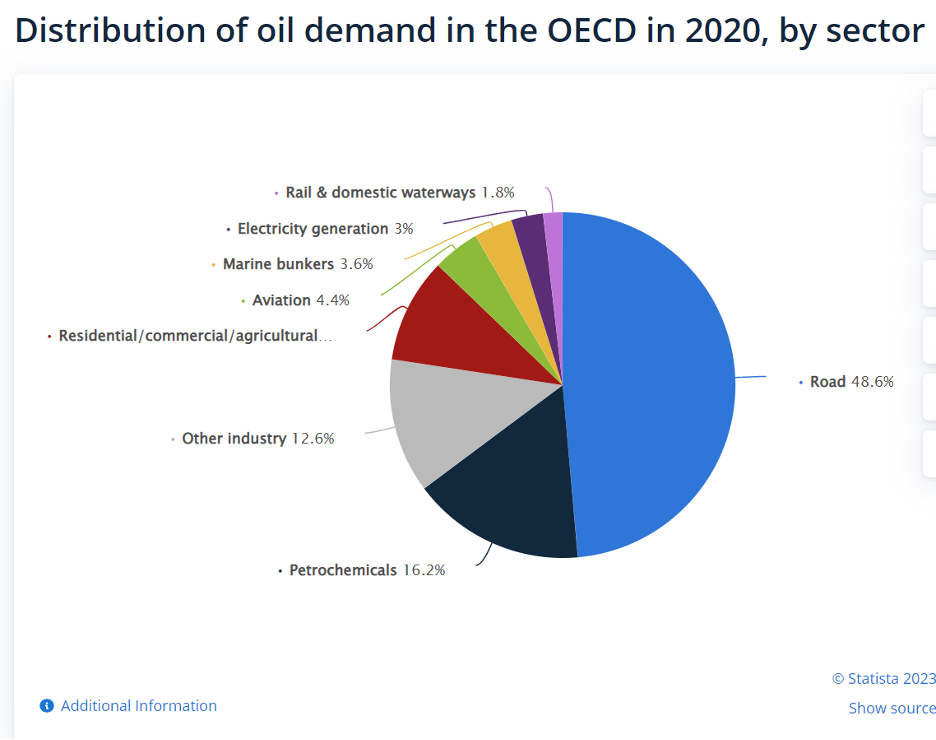
Before we get into supply, let’s briefly look at what that oil and gas is used for. In oil, 48% is used for road transportation, plus another 9.8% for shipping and air travel. Oil is also used for plastics, fertilizers, medicines, electronics, and to produce electricity and heating homes. It is hard to find something that neither directly uses oil and gas nor needs oil to get shipped to you. Demand for all these will grow as the rest of the world seeks to improve their lives.
Source: Statista
Supply of Oil and Natural Gas
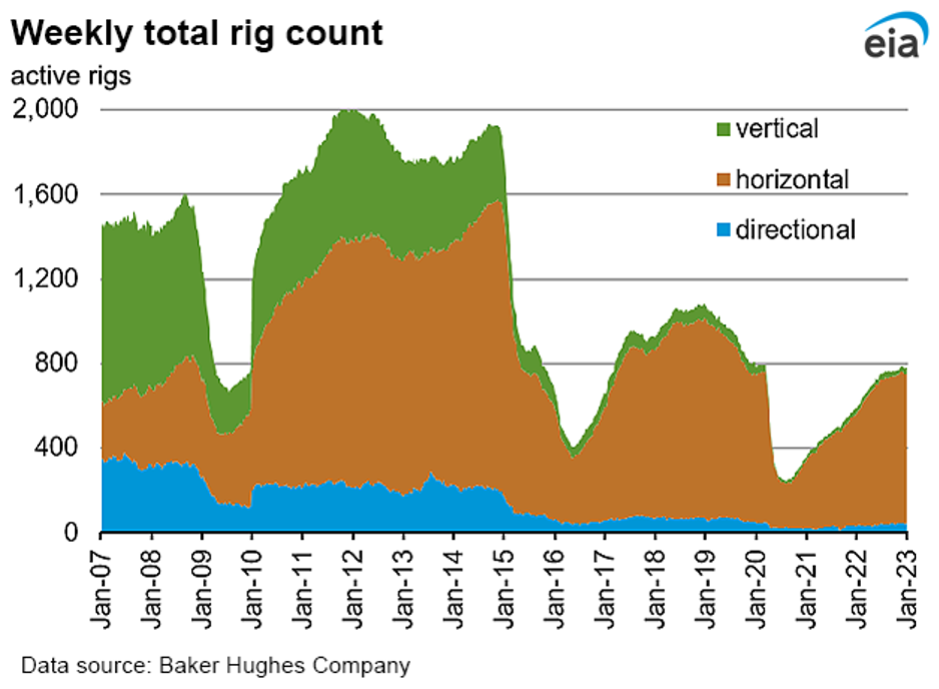
How are we doing on replacing that oil lost to depletion? In the US, we are actually increasing production, even with fewer rigs in use. This chart shows the difference between production from traditional vertical wells versus horizontal fracking. Notice that just eight years ago a significant portion of oil and gas came from simple vertical wells. I watched the forerunner for Mitchell Energy drill those wells in the home county of my youth – Wise County, Texas (the Barnett shale).
Source: EIA
Why isn’t the US doing more? We are basically just replacing general depletion plus a little more. The graph below shows the E&P and supermajors replacement rates. As of 2021 the larger public energy companies were not replacing what was lost to depletion but that can change.
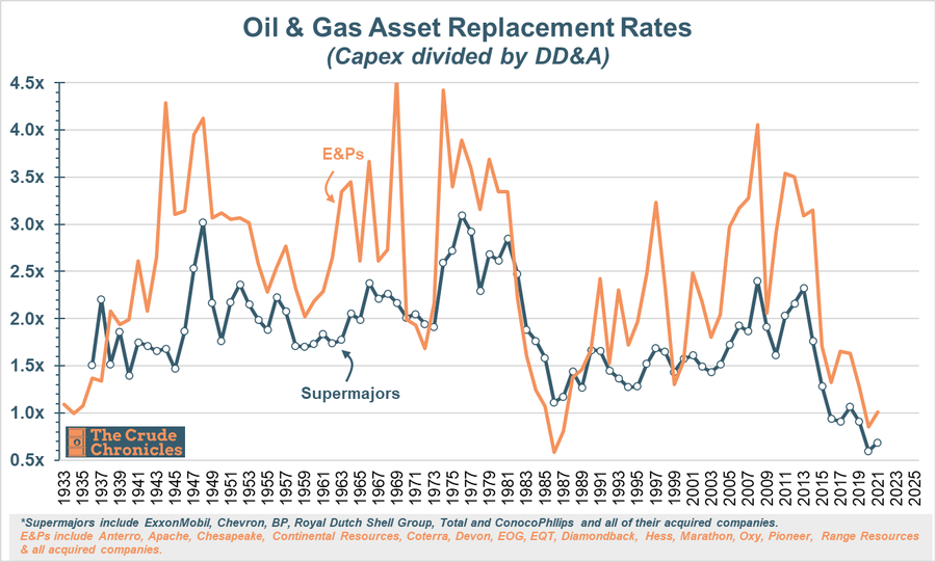
Why wouldn’t an oil company executive want to be drilling with oil prices in the $75 and up range? Isn’t $75 oil profitable? The simple answer is “yes, it is” and in a good field extremely profitable, at least on paper. But that isn’t the whole story.
The ESG movement is pressing banks and institutional investors not to invest in oil and gas, citing environmental reasons. I believe, and there is some consensus, that they are successfully reducing investments and capital oil and gas infrastructure world.
But investors and shareholders of oil companies are also to blame. The SEC requires oil and gas companies file a separate report with their 10-K that helps investors calculate a theoretical net asset value (NAV) based upon the proven and probable oil and gas reserves. In 2018, the NAV (ratio of price to value) of many mid-tier oil companies was 4.0 or higher even with oil at $51. Today many companies have an NAV of 0.8 – meaning investors aren’t valuing any new production. In fact, they give it a discount.
You’re the CEO. Do you spend $500 million to increase your oil production or to buy back your shares? It is arguably a better use of capital to invest in your own company at a reduced valuation than to produce oil or gas. You can read more details here.
Further, it is getting harder to find what is known as Tier 1 drilling locations. The US and the world are a long way from running out of oil. But many of the “fish in a barrel” wells have already been drilled over the last century.
To further complicate the equation, oil and gas inventories are dropping despite releases from the Strategic Petroleum Reserve. Russia is losing production capability because of their lack of access to western technology and expertise and announcing 500,000 bpd cuts as a way to explain the actual deterioration of their fields. (Russia is not going away, but it is no longer a swing producer.) OPEC is essentially running flat out and still several million barrels per day short of their authorized production. Saudi Arabia and the Emirates reportedly have no excess capacity. If they had extra capacity, at $80 Brent, you would think they would be opening the spigot a little more. Demand for oil is still growing.
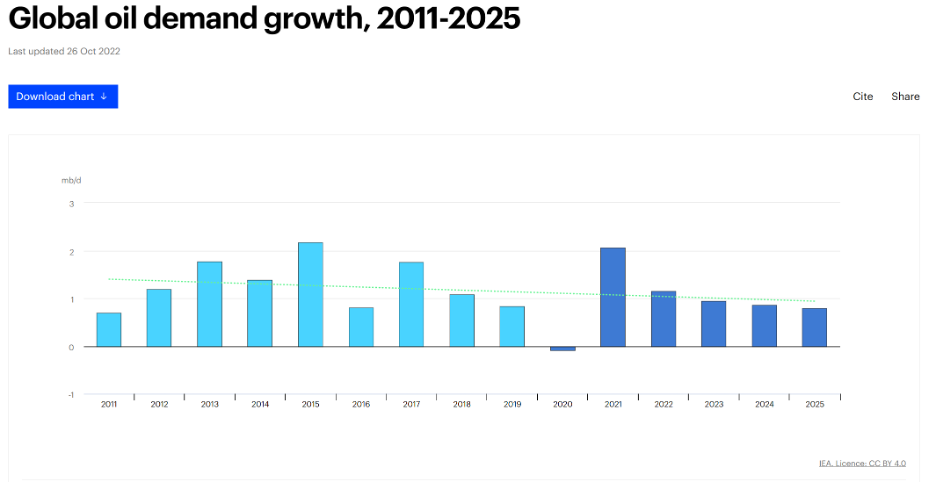
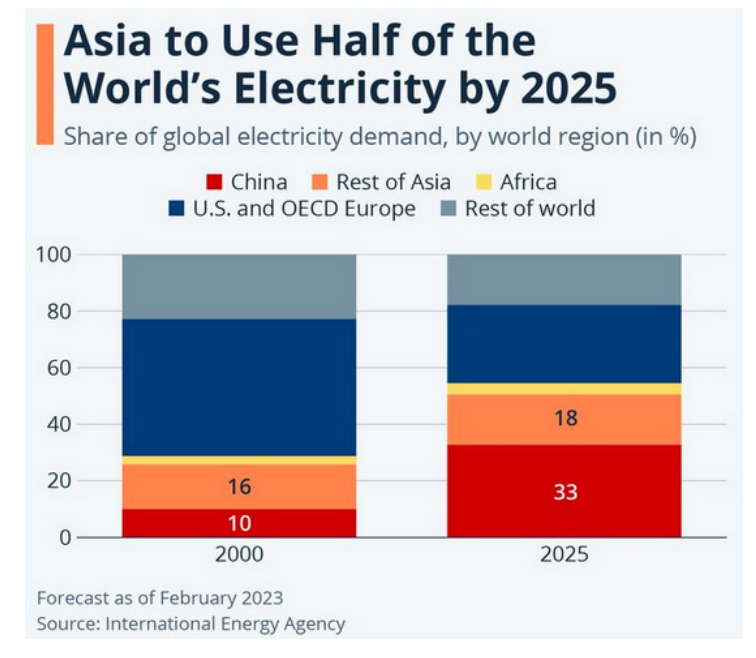
The increase in forecasted demand is largely a China story. It will be an India and rest of Asia story before the end of this decade. Here is a graph of world electricity use. The same concept applies to oil and gas demand.
Source: Statista
This next chart shows the annual increase in energy demand since 1966. Notice the larger drops are directly associated with recessions, and demand increased sharply after those drops. Those drops are associated with lower oil and gas prices. Even if demand is increasing, too much production (over demand) as in the first half of the last decade can drive prices down as well. I should state that even though I am bullish, oil and gas prices can drop significantly for a variety of reasons, not just recessions or overproduction.
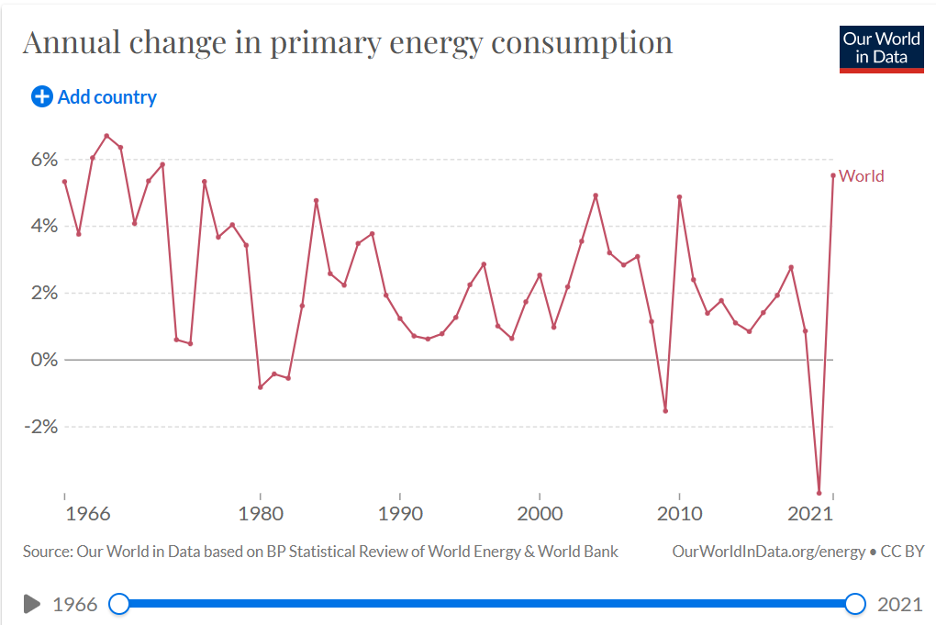
Source: Our World in Data
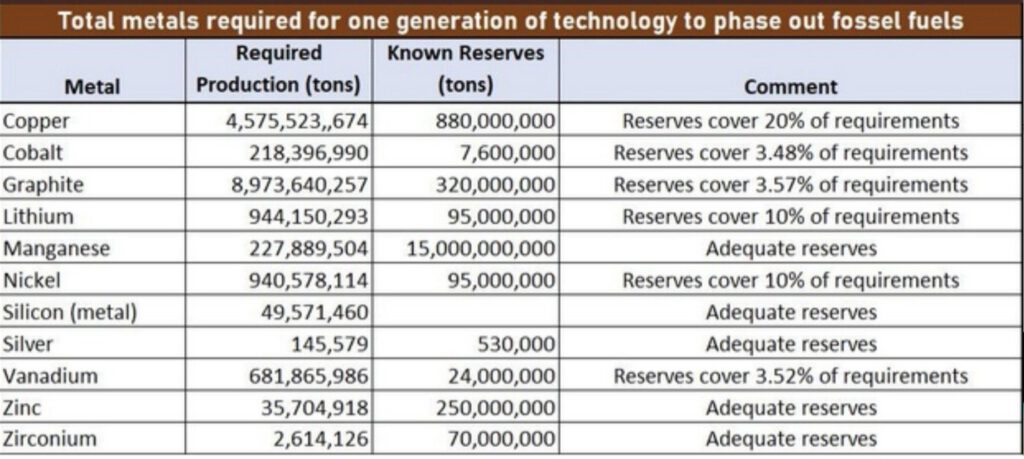
Finally, before we get into some thoughts on the Oil and Natural Gas Fund I mentioned in the Executive Summary of this paper, we should address the belief by those who think batteries powered by solar and wind will replace fossil fuels and batteries will allow widespread use of electric vehicles. That is going to be a tough hill to climb. Note in the charts above that solar and wind power, with all the literal trillions spent, is still less than 4% as of 2021. The world doesn’t have enough mines operating or even planned in the future to replace fossil fuels with wind turbines, solar panels and battery tech. According to the IEA, opening a mine takes 10-16 years on average.
The following is from the pro-renewable International Energy Agency. It shows that we are already short of various critical metals. You can find other estimates that are even more dire. We will need to open another 300+ major mines to make the equipment needed to transition according to various climate change organizations goals by 2035 or even 2050. Color me skeptical.
I do think we will transition away from atmospheric carbon producing electricity, but it will be nuclear. But that’s a topic for a later paper.
Source: EIA
Investing in an Oil and Natural Gas
How do you invest in oil and gas? You can buy public energy companies, mid-stream pipeline companies, ETFs, etc. but if energy CEOs are limiting their own investments, what does that tell you? For accredited investors, I think we have found a better way.
The key is to look beyond the actual price of oil and gas (though price is very important!)Rather, focus on the largely overlooked increase in the value of proven and probable reserves in the field and the opportunity it creates for those who can improve and sell those fields. Think of it as buying an older apartment complex in a good neighborhood, doing a complete renovation, increasing rent and then selling the complex at the higher value.
Essentially, what my partners at King Operating Corporation do is buy the rights to drill in an older but proven field in a “great neighborhood.” Today we are drilling in the Permian, the Big Horn in Wyoming, and in East Texas. Typically, the older fields are partially developed with aging vertical wells. We can improve their value with horizontal drilling and fracking.
While it may seem like these fields are all tapped out, in many cases, they are just the opposite. Think of a field like a stack of pancakes saturated in syrup. Stick a bunch of vertical straws into the stack and you are going to get a lot of syrup out. But not all straws are created equally. Some are too short to hit some of the cakes. Even good straws can only access a relatively small radius right…leaving stacks of cakes all over the plate still full of syrup. Going horizontal and loosening up the stacks…that’s a recipe for capturing a whole new volume of fresh syrup.
You drill enough to prove the new value of the field and then hopefully sell it at a meaningful multiple in a few years. (Past performance is not indicative of future results.)
Note that a two-mile horizontal fracking well can produce much more than numerous vertical wells, and at lower overall costs. Later papers will review the astonishing technology improvements of just the last few years.
Let me give you a very hypothetical illustration. This speculation has no bearing to anything in reality that I am aware of, but it does illustrate the point.
Assume you buy an oil field of 10,000 acres that had 10 wells drilled on it. Over time, the proven and probable reserves have been depleted. If you place your new horizontal fracking wells correctly using new drilling technology and practices, you can hopefully demonstrate that the field has more proven reserves available using.
Remember what we said about NAV above? Before any new drilling, our field had an NAV of X per acre based on proven and probable reserves. Strategically placing a limited number of new horizontal wells, in the right locations throughout the oil field will potentially demonstrate how much more potential proven and probable reserves there are available for drilling development at scale.
Done correctly, the field is now valued at a multiple of that original “X”. The more reserves you prove up, the more potentially valuable the field is. Of course, the real factor is how much the new wells produce. You can get a monster well or just enough to recover your investment, or even a dry hole.
Your “neighbors” are watching, learning what they can apply to their own fields. Pension funds, institutions and others are interested in the income generated, and other energy companies are interested in the new fields. And the price of oil and gas matters, as a 100,000 proven reserves field is worth more at $80-$100 a barrel than at $40-$50. It’s more complex than that, but that is the essence.
What’s in it for the accredited investor? Participation in the total upside – earnings from oil and gas revenues and then hopefully the selling of the actual field. I should mention there are significant potential tax benefits, as you can write either all or a portion of your investment against ordinary income. You must seek counsel from your tax advisor as to how and whether these tax benefits will apply in your individual situation.
Even more compelling is the opportunity to participate in monthly passive income from the sale of Oil and Natural Gas from producing wells that are part of the Fund. Initially, this income also has the potential to be tax sheltered because of how capital expenditures are treated in the oil space, but that varies with each well. Again, there’s more to it but it can be a significant benefit.
My partners at King Operating Corporation have helped pioneer this investment model (wells plus the field) for retail accredited investors. In fact, the Fund will be large enough to be developing in multiple fields with multiple wells. This provides the operator freedom to choose between oil or gas fields (depending on current prices) and to develop some fields faster due to potential investors looking to buy the field.
My partner Jay Young, the founder of King Operating Corporation, calls this the ADD process: Acquire, Develop and Divest. This is the real difference of the King model: oil and natural gas sales will get you monthly income, which is nice, but divesting that field for a hopefully significant multiple is the goal. And while we are waiting, it is possible that private funds will want to buy a portion of the field, which is the typically given back to the investors.
I can’t go into much more detail until you have an offering document. You can, however, set up a call with one of our experienced senior VPs to review the entire process. We have videos and webinars you can watch. I will be doing regular webinars with the team you can listen to. I have done interviews with senior management and you can get a feel for who they are in just a few minutes. Their team is very impressive, and I like that there is a lot of gray hair in the room. This seasoned team has drilled multiple thousands of wells over their careers all over the world. You want to learn more about them as they are the people who will make or break your returns.
What should you do now? CLICK HERE to arrange a time for a call with one of my Senior Vice Presidents.
Feel free to drop me a note as well, HERE. I am here, along with the entire team at King, to make sure you have as great an experience as possible. All the best!
Your getting back to my roots in the oil patch analyst,
John Mauldin

1 thought on “The Future of Energy – Part One”